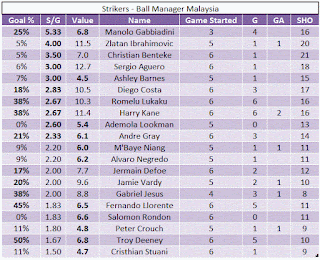
This time we will reviewing the latest statistics starting from gameweeks 22 until gameweeks 27. The players with the highest numbers of shots is our target.
Visitors also viewing ~ Percentage of goal scored per total shots by EPL key players
Referring to our tables below, the first column is (Goal %). Goal % is Percentage of goal scored per total shots or we can say 'the percentage of shots converted into goals'. So if the player has higher (Goal %) means the player are better in converting chance into a goal.
The second column is (S/G) Shot Per Game. Every players has a different numbers of game started, so the best way to rank them is by using 'the number of shots per game for every players'. Player with highest shots per game will be at the top of the tables. This numbers will give us an idea on number of chances they got in each match.
Defenders
 |
| Defender - Percentage of goal scored per total shots |
Note:
1. Data are based on player performances from GW22 until GW27.


No comments:
Post a Comment